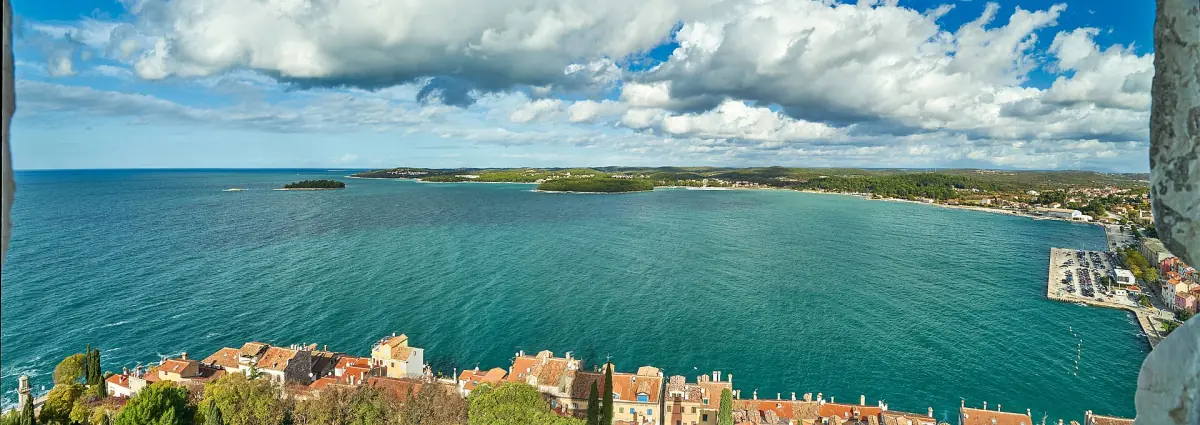
Istria weather in short
The warmest weeks are in July and August. The wettest months are October and November. July has the lowest monthly rainfall in the table below. If you want beach days, plan for the summer. If you prefer sightseeing without the heat, May, June and September are worth a look.
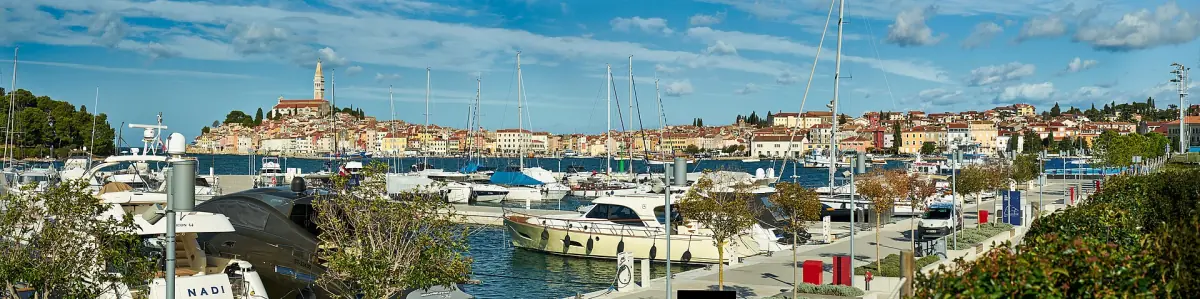
The monthly figures come from the Croatian meteorological service (DHMZ) and describe Rovinj on the west coast, averaged over 1971–2000. That is an older reference period. Use it to compare months with each other, not as a forecast for your dates. Other places on the coast and inland will differ in detail, so check a forecast a few days before you travel.
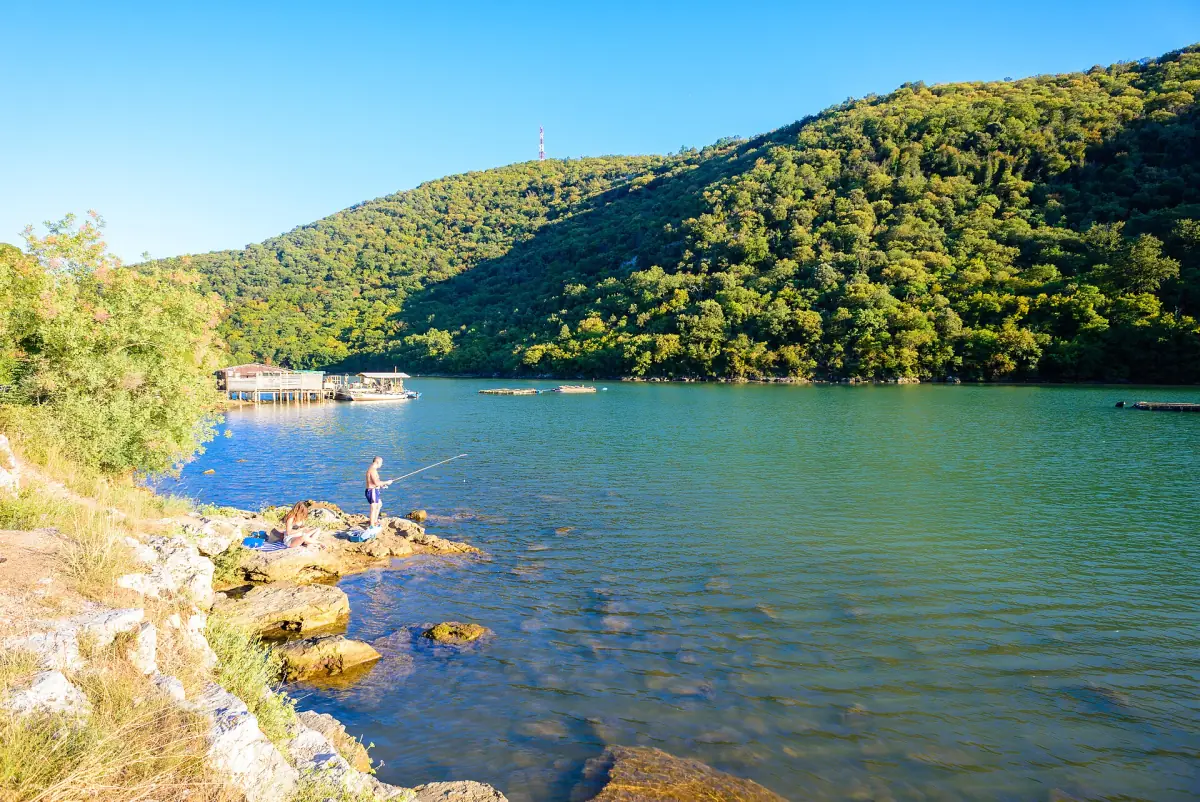
Istria temperatures and rainfall by month
Rovinj, averages for 1971–2000. Highs and lows are averages of the daily highest and lowest temperatures.
| Month | Average high | Average low | Rainfall |
|---|---|---|---|
| January | 9.6°C | 1.8°C | 59.5 mm |
| February | 10.6°C | 1.6°C | 50.3 mm |
| March | 13.4°C | 4.0°C | 55.0 mm |
| April | 16.7°C | 7.2°C | 63.3 mm |
| May | 21.7°C | 11.6°C | 56.4 mm |
| June | 25.4°C | 14.9°C | 72.1 mm |
| July | 28.5°C | 17.2°C | 40.7 mm |
| August | 28.7°C | 17.2°C | 64.5 mm |
| September | 24.6°C | 14.0°C | 83.1 mm |
| October | 19.9°C | 10.2°C | 97.0 mm |
| November | 14.4°C | 6.0°C | 98.3 mm |
| December | 10.8°C | 3.2°C | 71.2 mm |
Rainfall is the average monthly total. The table does not show sea temperature or hours of sun, so it cannot tell you how warm the water feels in a given week.
Boat trips, truffle hunts and day trips in Istria
Coast and hill town trips that suit a range of seasons, with live prices and availability.
What each season means for your trip
Opening hours and fees below are published for 2026 and can change.
Spring: March to May
Highs rise from 13.4°C in March to 21.7°C in May, and nights stay cool. Sightseeing is comfortable. In April the Pula arena is open from 8 am to 8 pm, and in May from 8 am to 9 pm. The adult ticket is €10 and children, pupils and students pay €5. The summer truffle season starts on 1 May, according to the regional tourist board.
Pula and the arena →Summer: June to August
This is the beach season, with highs of 25.4°C in June and about 28.5°C in July and August. July is the driest month in the table. Cape Kamenjak charges motor vehicles a day fee from 15 June to 15 September: €20 for a car in the main season, with 10% off online. Pedestrians and cyclists do not pay. The arena is open from 8 am to 10 pm from June to August.
Istria beaches →Autumn: September to November
September still reaches 24.6°C, but rainfall climbs to 83.1 mm. October and November are the wettest months, with 97.0 and 98.3 mm. This is truffle time: the white truffle season runs from 15 September to 31 January, and in 2026 the Zigante Truffle Days in Livade are held at weekends from 3 October to 1 November. The Brijuni guided tour is cheaper from 1 October, when low-season prices apply again.
Istria truffles →Winter: December to February
Highs stay between 9.6°C and 10.8°C, and lows fall to 1.6°C in February. The arena is open from 9 am to 5 pm from November to March. Black truffles are in season from 1 November to 15 March. Old towns and museums suit these months better than boat trips.
Things to do →Best time to visit by plan
Match your main interest to the months that suit it.
| If you want | Look at | Why |
|---|---|---|
| Beach days | July and August | Highest highs, 28.5°C and 28.7°C, and the lowest July rainfall |
| Sightseeing without peak heat | May, June and September | Highs between 21.7°C and 25.4°C |
| Truffles | October to January | White truffle season from 15 September to 31 January, black from 1 November to 15 March |
| City visits off season | November to March | Cool days, more rain in autumn, arena hours 9 am to 5 pm |
| Brijuni island tour | Any month | Adult guided tour €35 in low season and €50 in high season (1 June to 30 September), 2026 |
One extra date for 2026: the Brijuni autumn offer runs from 23 October to 1 November, at €17 for adults and €12 for children aged 7 to 18 on the guided tour. The Brijuni page has the details.
Swimming, sea and events
What to know about the water and the calendar.
Bathing water quality
In the ninth round of tests, from 8 to 16 September 2026, Istria's public health institute checked 222 measuring points. Of these, 219 were rated excellent (98.6%), two good and one satisfactory. One sample is a snapshot of one week, not a rating for the whole season, so beaches can still be closed for a short time.
Currents and swimming limits
At Cape Kamenjak the rules ask swimmers to stay within 100 m of the shore and warn of strong currents, especially between Kršine and Fenoliga. Wind and waves change the picture from day to day, so look at the sea before you go in.
Fire restrictions
In dry weather, open fires can be banned. A notice from June 2026 banned open fires, including grilling, at Kamenjak. Check the current rules before you plan a barbecue.
Tennis in July
The ATP tournament in Umag takes place in mid July, and the final was announced for Saturday 18 July 2026. If you plan to stay nearby, book early.
Umag →Plan the rest of your trip
Pick your season, then your base.
Istria weather: frequently asked questions
When is the best time to visit Istria?
It depends on the plan. For swimming, July and August are the warmest months. For sightseeing without peak heat, May, June and September are comfortable, with highs of 21.7°C to 25.4°C in the Rovinj table. For truffles, autumn is the main season.
Which months are the wettest?
October and November, with 97.0 and 98.3 mm on average in Rovinj. September is next at 83.1 mm. July is the driest month in the table, at 40.7 mm.
How cold is Istria in winter?
On the coast at Rovinj, average highs are between 9.6°C and 10.8°C from December to February, and average lows fall to 1.6°C in February. Temperatures vary from day to day, so pack layers.
Is the weather table a forecast?
No. It is a long-term average for Rovinj from 1971–2000. It helps you compare months, but it cannot predict the weather on your dates. Check a forecast shortly before you travel.
Does the table apply to Pula and Poreč?
The figures describe Rovinj. Pula, Poreč and the inland hill towns will differ in detail, so treat the table as a rough guide for the west coast only.